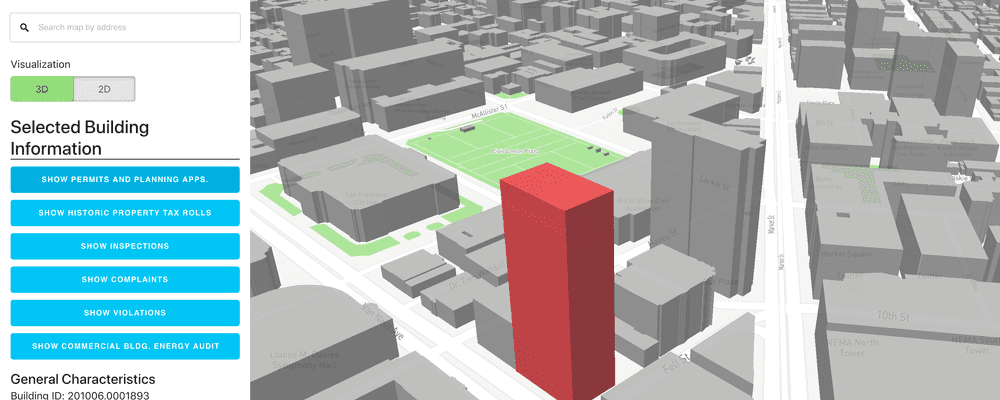
San Francisco Building Explorer
Project goals
In May of 2017, new building footprints were released to the open data portal. To help showcase the release, we wanted to build a simple demonstration app that:
- Visualized the usage of the 3D attributes derived from LiDAR
- Demonstrated linking data from other open data APIs
- Provided transparent, open source code so others could be inspired
- Was easy enough to deploy locally and poke around without a lot of tooling or special knowledge of frameworks
Approach
I placed emphasis on keeping code dependencies small using minimal libraries and no frameworks. It’s a Javascript/CSS/HTML site with a single index.html. Ultimately, we wanted to develop an MVP, not a full-fledged application.
I also wanted someone to pick through the code and build understanding of what’s happening without having to understand a particular framework.
While I would not consider the codebase best practice, it meets the need and has provided people with a reference application for other purposes. For example, querying open data APIs in a frontend application.
This approach is inspired by Mapbox code examples, albeit a bit more involved.
Outcomes & Lessons
- Demonstrated what an “MVP” can look like to City staff and leadership in terms of time spent and deliverable
- Used as a reference application when people want to understand how to incorporate open data API queries in their web app
- Surfaced data quality issues in datasets that informed the data standards handbook
- Worked out patterns that could be used if iterated into a more robust application
Technology involved
- Mapbox GL JS
- Turf.js
- Wellknown
- Vanilla JS
- HTML
- CSS
Out in the world
The @DataSF team continues to impress. Check out this amazing SF building explorer! https://t.co/ZIG2Mo0cUx
— Steven Buss 🥑 🌐 (@sbuss) October 22, 2018
Boom. Huge release from @DataSF! Individual building data...nice, clean & organized...in 3D....at your fingertips 🏢🚀 https://t.co/m0WfplFEg6
— #civicinnovation (@SFMOCI) June 1, 2017